
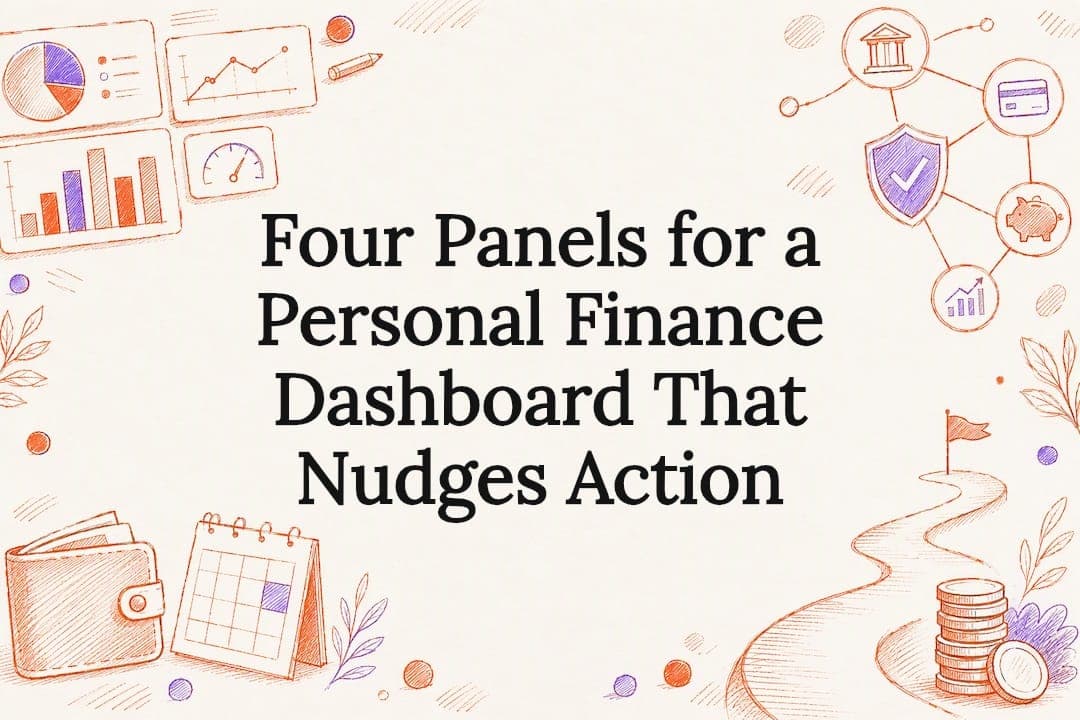
Four Panels for a Personal Finance Dashboard That Nudges Action
By Maanya Nagpal
Build a decision-focused personal finance dashboard in four panels. Pilot one week, automate transfers and alerts, and use behavioral nudges to turn...
A personal finance dashboard works when it shows six things: opening cash, monthly income, categorized spending, upcoming bills, savings progress, and net worth. The fastest way to get one running is to skip the perfect template and start with a one-week pilot, or a single month of transactions, so you have real numbers to organize instead of empty boxes. Build the panels next, then turn each number into a decision.
TL;DR:
A personal finance dashboard should include opening cash, weekly cash-flow, categorized spending, upcoming bills, savings progress, and net worth for effective decision-making.
Building the dashboard in a specific order—starting with baseline data, linking accounts, and adding one or two key panels—helps prevent clutter and burnout.
Regular account verification and setting classification rules are essential to maintain accurate, secure data and avoid category drift.
Automating transfers, bill payments, and setting rule-based alerts improves habit formation and ensures consistent progress tracking.
Focusing on a few decision-support panels daily is more effective than maintaining numerous charts that lead to monitoring fatigue.
Table of Contents
What should a personal finance dashboard actually include?
Most dashboards fail for the same reason: too many charts, not enough decisions. The CFPB’s Your Money Your Goals toolkit found that a practical minimum set of panels beats a sprawling one, because each extra metric adds monitoring fatigue without adding a next action.
Here’s what earns a spot on a working dashboard:
Opening cash — what you actually have right now, not what you had on payday.
Monthly income and totals — every deposit, categorized by source.
Weekly cash-flow carry-forward — this week’s ending balance rolled into next week, which exposes timing gaps between paydays and big bills before they cause an overdraft.
Spending by category — using consistent groups like groceries, housing, transport, and debt payments, similar to the categories in the CFPB spending tracker.
Upcoming bills — due dates and amounts, visible before they’re due, not after they’re late.
Savings-goal progress — a bar or percentage tied to a real target, not a vague “save more” line.
Net worth — assets minus liabilities, tracked over time rather than as a single snapshot.
Debt balances and investment overview — so paying down a credit card and rebalancing a portfolio aren’t competing for attention in the same glance.
Each panel supports a different decision. The weekly cash-flow view answers “can I afford this before Friday,” while the monthly totals answer “did I overspend on dining.” Net worth answers a longer question entirely: is your overall position improving, even if this month’s spending looked messy? Investor updating net worth at least annually while checking income and expenses more often.
The most common failure point isn’t a missing panel. It’s category drift, where a “transfer” gets logged as spending, or a refund shows up as new income and inflates a category that never actually grew. Set classification rules before you chart anything, and revisit them the first time a number looks wrong.

How do you build a dashboard step by step?
Building a dashboard in the right order prevents the two most common outcomes: giving up halfway, or building something so cluttered you stop checking it. Follow this sequence.
Capture a baseline. Export your last month of transactions, or screenshot account balances if exporting feels like too much. The CFPB suggests starting with just one or two weeks if a full month feels like a heavy lift, then expanding once the habit sticks.
Import or link accounts, then normalize. Whether you’re pasting a CSV or connecting accounts through an app, create rules immediately: transfers between your own accounts are never spending, and refunds get reconciled against the original charge rather than counted as fresh income.
Build views in this order: opening cash, income, weekly cash-flow, categorized spending, upcoming bills, net worth, investments, then a short action list. Building in this sequence keeps the dashboard decision-first instead of chart-first.
Add one or two exception alerts. A large unexpected charge and a low cash-buffer warning cover most real emergencies without turning the dashboard into a notification firehose. Set a reconciliation cadence, weekly for cash-flow, monthly for spending categories, so the alerts stay trustworthy.
Pro Tip: Cap your widget count before you start, not after. If you can’t explain what decision a panel supports in one sentence, cut it. A dashboard with five panels you check daily beats one with fifteen you check never.
How do you keep synced data accurate and secure?
Linked accounts save time, but they aren’t infallible. The first sync should be checked line by line against your actual bank statement, because feeds routinely miss pending transactions, duplicate entries, or misfile a transfer as external spending. CFPB guidance on data sharing treats account authorization as an ongoing task rather than a one-time setup step.
A few habits keep both accuracy and privacy in check:
Keep a running list of every service with access to your accounts, not just the one you use daily.
Revoke permissions for apps you stopped using months ago; unused access is unmonitored risk.
Request data deletion when a service closes or when you switch tools entirely.
Change financial-account passwords if a service you shared credentials with ever discloses a breach.
Keep your baseline export or screenshot from Step 1 as a manual reconciliation path, so a silent sync error doesn’t quietly distort months of data.
How do you turn dashboard numbers into real financial action?
A chart that just sits there isn’t a tool, it’s a report. The gap between the two is a routine.
Run a weekly cash-flow check, a monthly pass to adjust budget categories, and an annual net-worth review that measures progress rather than judges a single number. A negative net worth this year isn’t a verdict; it’s a starting line, and the trend matters more than any one snapshot.
Automate what you can, because scheduled transfers tend to outperform willpower for building a cash buffer. The FDIC recommends automating savings and notes many experts point to roughly six months of expenses as a savings target, though the right number depends on your own situation. Beyond savings automation, set up automatic bill payments and rule-based alerts for overspending or a shrinking buffer.
Schedule a recurring transfer the same day your paycheque lands, before you see the balance.
Set a rule-based alert for any category that exceeds its typical monthly total by 20% or more.
Rebalance investments on a fixed schedule (professionals often review every six to 12 months) instead of reacting to daily price swings.
Pro Tip: When your dashboard shows both a debt balance and a dipping investment line in the same week, fix the debt first. Guaranteed interest savings almost always beat an uncertain market bounce.
Why habits decide whether a dashboard actually gets used
A dashboard only works if you open it. A five-minute daily check, glance at cash-flow, note one insight, take one action, builds the habit faster than a monthly deep dive ever will. Psyfiapp’s budget-tracking micro habit approach pairs that daily glance with real-time coaching, so a spending pattern gets flagged the week it starts, not the month it becomes a problem.

What I’d build first if I were starting today
Skip the elaborate template. Start with opening cash, weekly cash-flow, categorized spending, and one savings goal. That’s four panels, not twelve, and each one drives a decision you’ll actually make this week.
Fewer metrics tied to real choices beat a wall of isolated charts every time. Add net worth once the habit sticks, not before.
— Maanya
How PsyFi turns dashboard habits into automatic wins
Building the panels above by hand works, but it takes discipline most people lose by week three. An app closes that gap by linking your accounts once and generating the same core views, cash-flow, categorized spending, savings progress, and net worth, automatically, then pairing each one with a behavioural nudge instead of a static chart.
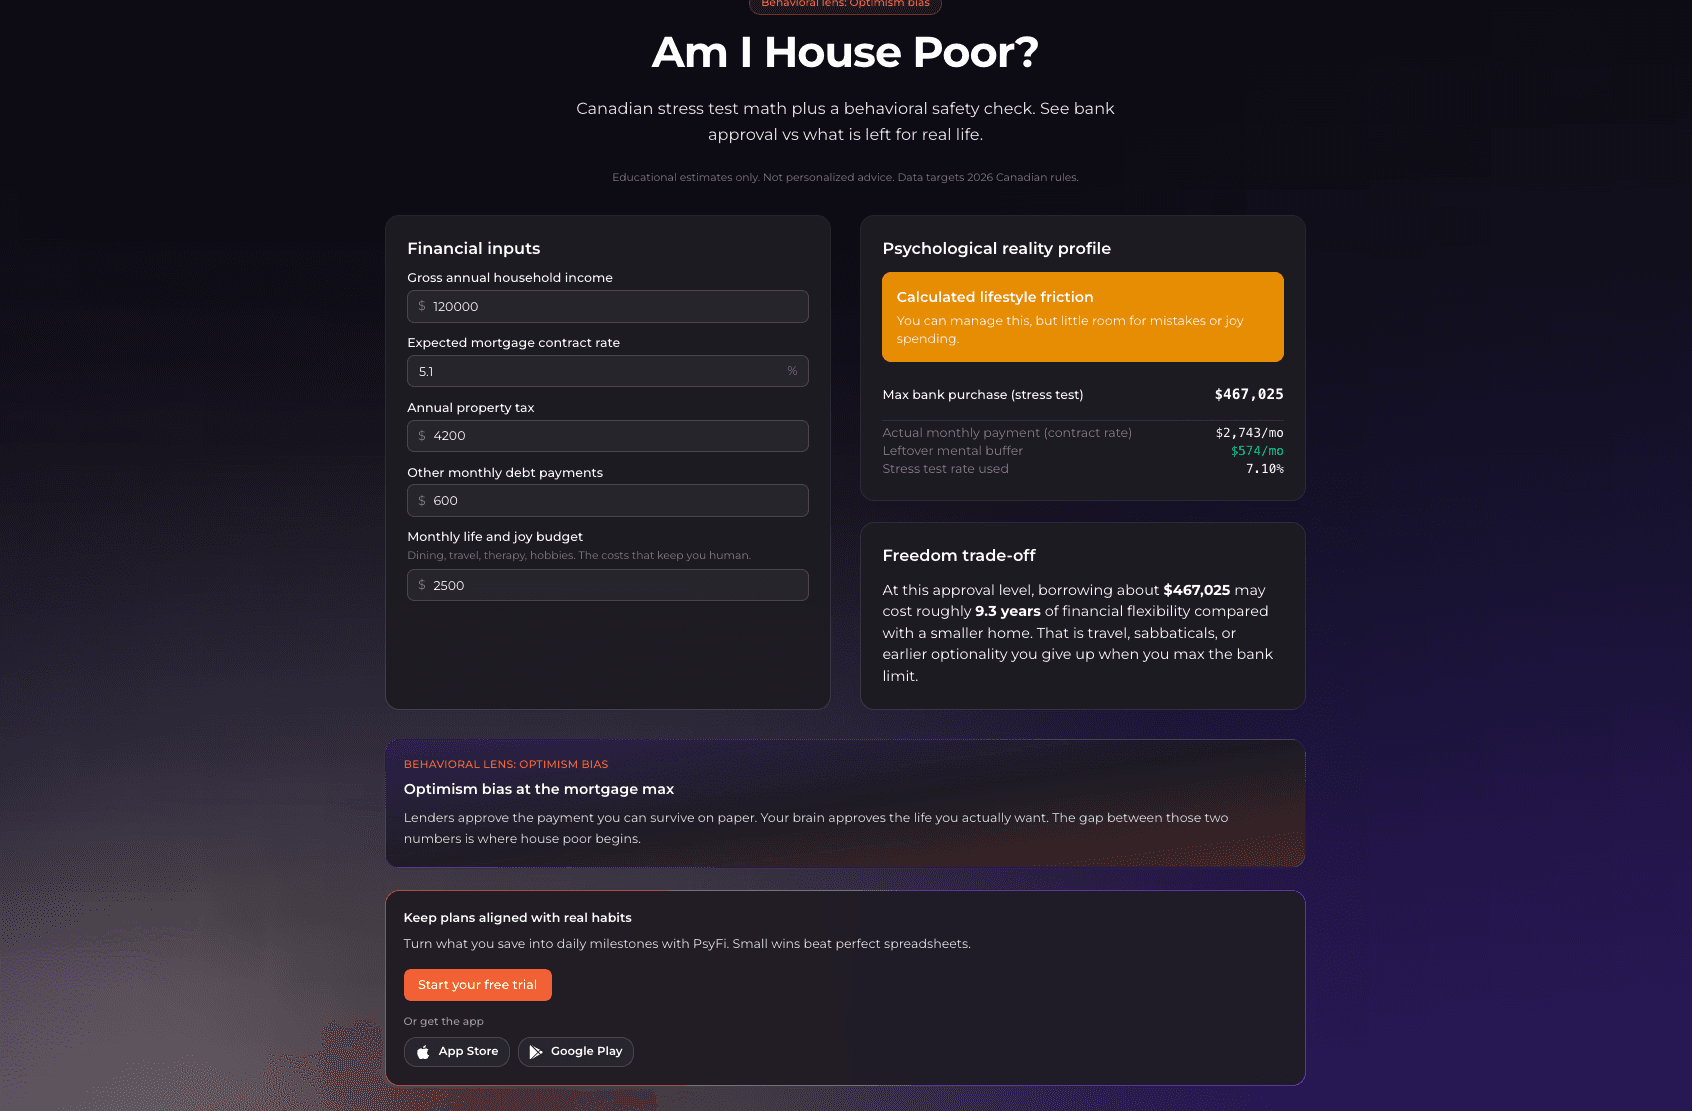
That’s the real difference from a spreadsheet template: a patent-pending engine watches for the pattern (overspending late at night, a stalled savings goal) and coaches you toward the next action in real time, rather than waiting for your monthly review. You can test the approach with the free net worth calculator or the savings goal calculator, both built on the same panels this article recommends. For the full coaching experience, including automated savings routines and slip-up alerts, Premium runs $9.99 USD per month after a 7-day free trial. Start your trial and let the dashboard build itself around your actual habits.
Where to go for the primary guidance
This article is general information, not a substitute for advice from a qualified financial advisor. Consult a qualified financial professional about your own circumstances before acting on anything here.
Sources
FAQ
What’s the minimum a personal finance dashboard needs?
At minimum, track opening cash, monthly income, categorized spending, upcoming bills, one savings goal, and net worth. Adding more panels than that usually causes monitoring fatigue rather than better decisions.
How often should I update my net-worth panel?
Update net worth at least once a year, though checking it quarterly helps you catch trends early. Investor.gov recommends reviewing income, expenses, and investments more frequently than net worth itself.
Should I link accounts automatically or track manually?
Linked accounts save time but need verification against your bank statement on the first sync, since feeds can miss pending charges or duplicate entries. A hybrid approach, linked accounts plus a monthly manual check, catches errors either method alone would miss.
How much should my savings-goal panel target?
Many experts suggest building toward roughly six months of living expenses as a starting emergency fund, according to FDIC guidance, though your own number depends on income stability and dependants. Automating a transfer the day you’re paid tends to build that buffer faster than manual saving.
Does Psyfiapp replace a DIY dashboard template?
Psyfiapp automates the same core panels, cash-flow, spending, net worth, and savings progress, while adding behavioural coaching that a static template can’t. Premium costs $9.99 USD per month after a 7-day free trial, and the free calculators let you test the core panels first.
Recommended
This content is provided for general informational and educational purposes only and does not constitute financial, investment, tax, or legal advice. PsyFi provides financial coaching tools and behavioral insights, not regulated advisory services. Always consult with a qualified financial advisor or tax professional regarding your personal situation before making financial decisions.
Keep reading
- End budgeting burnout with one automatic transfer todayRecover from budgeting burnout with a behavioral science reset: simplify tracking, automate one transfer, and follow a staged 30/60/90 plan. Try...
- 30 Minute Monthly Reviews to Build a Financial Checkup RoutineBuild a sustainable money routine with 30-minute monthly reviews, quarterly checkups, and annual audits to keep your finances on track without decision fatigue.
- The fastest way to build lasting saving motivation