

4 Steps to Calculate Your Savings Rate Using Take Home Pay
Calculate your savings rate from take home pay in four steps. Two worked examples, a copy paste spreadsheet checklist, simple habits, and PsyFi tools to...
The formula is simple: divide your total savings for a period by your income for that same period, then multiply by 100. Most people should start with take-home pay as the income base since it’s easier to track and matches what actually lands in your bank account. Count retirement contributions, employer matches, and investment deposits as savings. Skip the spreadsheet paralysis and calculate it once this month.
TL;DR:
Using a rolling 12-month average provides a more accurate picture of your savings behavior by smoothing out short-term fluctuations and one-off expenses.
Sticking to either gross income or take-home pay consistently is crucial, with gross better for comparisons and take-home more behaviorally honest for tracking habits.
Contributions to retirement accounts, employer matches, investment deposits, and extra debt payments count as savings, while regular living expenses do not.
Automating transfers and scheduling incremental contributions can significantly increase your savings rate with less effort and willpower.
Regularly tracking your savings rate over several months helps monitor progress and set realistic targets based on your financial goals and life circumstances.
Table of Contents
Which formula should you use: gross income or take-home pay?
What’s a good savings rate and how do you set a realistic target?
What is savings rate and why it matters
Your savings rate is the percentage of income you set aside rather than spend, measured over a period you choose. That period matters more than most people realize. A single month can swing wildly if you got a bonus, paid an insurance premium, or covered an unexpected car repair.
That’s why a rolling 12-month average tends to give a truer picture than any one month or even a single calendar year snapshot. It smooths out the noise from bonuses, tax refunds, and one-off expenses, showing sustained behaviour rather than a lucky spike, according to the community behind ChooseFI’s savings rate calculator.
The number connects directly to two things you actually care about: how fast your net worth grows, and when you can realistically stop working full-time. A higher savings rate compounds in two directions at once. It builds your investment balance while shrinking the future lifestyle you’ll need to fund, which is why financial independence communities treat this single percentage as their primary dashboard metric.
Which formula should you use: gross income or take-home pay?
Both formulas work. They just answer slightly different questions, and picking the wrong one for your situation muddies your results.
Gross income formula: Savings Rate = (Total Savings ÷ Gross Income) × 100
Take-home income formula: Savings Rate = (Total Savings ÷ Net Income) × 100
Here’s how they diverge with real numbers. Say you earn $70,000 gross, take home $54,000 after taxes and deductions, and save $8,000 across the year including a 401(k) contribution.
Gross-based rate: $8,000 ÷ $70,000 × 100 = 11.4%
Take-home-based rate: $8,000 ÷ $54,000 × 100 = 14.8%
Same savings behaviour, two different numbers. Neither is wrong, but they tell different stories.
Gross income has one clear advantage: it’s standardized, which makes it useful for comparing your rate against national benchmarks or against a friend in a different tax bracket. Fidelity’s calculation guide leans on gross income for exactly this reason, since take-home pay varies by state, filing status, and benefit elections in ways that make cross-comparison messy.
Take-home income wins on a different front: it’s behaviourally honest. It reflects the actual dollars you decide what to do with each payday, which makes it far easier to track without pulling out old pay stubs to reverse-engineer your gross figure. DeliberateChange recommends beginners start here for exactly that reason, simplicity beats precision when you’re building a new habit.
A few situations call for exceptions to whichever default you pick:
Self-employed workers should use net business income after deductible expenses, not gross revenue, since gross revenue overstates what’s actually available to save.
High pre-tax contributors (someone maxing out a 401(k) or HSA) will see gross-based rates look artificially low relative to their real savings effort, so take-home may better reflect the win.
Variable-income households, think commission-based sales or seasonal work, benefit from averaging income across a full year before applying either formula, since any single month misrepresents the trend.
Pick one method and stick with it across periods. Switching formulas month to month makes your own trend line meaningless.
What counts as savings and what doesn’t
Getting an accurate number depends entirely on drawing a consistent line around what counts as “savings” versus what’s just money that passed through your account.
Count these as savings:
Retirement contributions, both your own pre-tax and after-tax amounts (401(k), IRA, RRSP if you’re calculating in Canadian terms)
Employer contributions and matching funds, since that’s real money building your net worth even though you didn’t directly deposit it
Taxable brokerage or investment account deposits
Emergency fund contributions, whether that’s a high-yield savings account or a separate buffer account
Extra principal payments on a mortgage beyond the required minimum, because that portion builds equity rather than covering a required living cost
Leave these out:
Everyday chequing account balances earmarked for spending, even if the number happens to be sitting there at month’s end
Your required mortgage or rent payment, since that’s a housing cost, not savings, though the extra-principal portion above still counts
Credit card payments that simply clear spending you already did that month, since paying off your own consumption isn’t building wealth
A few grey areas deserve their own rule. Employer defined-benefit pension accruals (the kind that promise a fixed payout in retirement rather than a contribution-based balance) are better tracked as a separate wealth stream rather than folded into your monthly savings rate, since Finiki’s savings rate explainer notes these accrue on a different timeline and formula than a defined-contribution account. HSA-type accounts count as savings when you’re not spending the balance down each year. And debt paydown deserves a specific framing: extra payments toward high-interest debt function like a savings contribution because they raise your net worth just like an investment deposit would, even though no account balance grows.
How to calculate your savings rate step by step
Four steps get you a defensible number, whether you’re doing this in a notebook or a spreadsheet.
Choose your period and income base. Pick monthly or annual, and decide gross or take-home based on the guidance above. Write both choices down so you stay consistent next time.
Aggregate your total savings for that period. Add every qualifying contribution: retirement deposits, employer match, brokerage deposits, emergency fund builds, extra debt principal.
Divide savings by income, then multiply by 100. That’s your raw savings rate for the period.
Interpret it against a trend, not a single number. Repeat the calculation across several months and average them, since one snapshot rarely tells the full story.
Worked example A: monthly take-home income
Sarah takes home $4,200 per month after taxes and deductions. In March, she contributed $300 to her Roth IRA, put $200 into a high-yield savings account, and paid an extra $150 toward her mortgage principal beyond the required payment.
Total savings: $300 + $200 + $150 = $650
Savings rate: ($650 ÷ $4,200) × 100 = 15.5%
That lands right in the commonly cited “solid target” range, which we’ll unpack in the next section.
Worked example B: annual income including employer match
James earns $85,000 gross annually. Across the year, he contributed $6,000 to his 401(k), and his employer matched $2,500. He also put $1,500 into an HSA and deposited $3,000 into a taxable brokerage account.
Total savings: $6,000 + $2,500 + $1,500 + $3,000 = $13,000
Using gross income: ($13,000 ÷ $85,000) × 100 = 15.3%
Notice the employer match adds real ground here. Without it, James’s rate drops to 12.4%, a meaningful gap that plenty of people miss because that money never technically touches their own account.
Spreadsheet checklist to track it monthly
Set up these columns in whatever spreadsheet tool you already use:
Month
Gross income
Take-home income
Retirement contributions (yours)
Employer match
Brokerage/investment deposits
Emergency fund contributions
Extra debt principal
Total savings (sum of the above)
Monthly savings rate (%)
12-month moving average (%)
For that moving average column, sum your total savings and total income across the trailing 12 months, then apply the same formula to those two sums rather than averaging 12 individual percentages, which distorts the result when income varies month to month. A basic online tool, like the ChooseFI savings rate calculator, handles this automatically if you’d rather skip building your own sheet.
What’s a good savings rate and how do you set a realistic target?
Financial planners generally point to a few common bands, though where you land depends heavily on your specific goals and timeline.
A baseline savings rate is often considered a floor, useful mainly as a signal that you’re not living entirely paycheque to paycheque. A moderate savings rate range is commonly recommended for someone aiming for a conventional retirement in their sixties, according to Fidelity’s guidance. A stronger position represents those who want cushion against job loss or an earlier retirement. Very high rates show up almost exclusively in FIRE (financial independence, retire early) circles, where the explicit goal is compressing a multi-decade working career into a shorter period.
The right target for you depends on variables a flat percentage can’t capture, especially when facing exceptional life events that affect your savings, as explained in how to prepare financially for divorce. Finiki’s breakdown of required savings rates shows how the number shifts based on your income replacement target, time horizon, and assumed real investment returns, meaning two people with identical incomes can need very different rates depending on when they want to retire and how their portfolio performs. Someone with a defined-benefit pension needs a lower personal savings rate than someone relying entirely on their own investments. A homeowner nearing the end of a mortgage has more room to redirect cash than a renter facing rising costs. Kids, existing debt, and age all shift the math too, a 25-year-old and a 50-year-old chasing the same 20% target face very different runway.
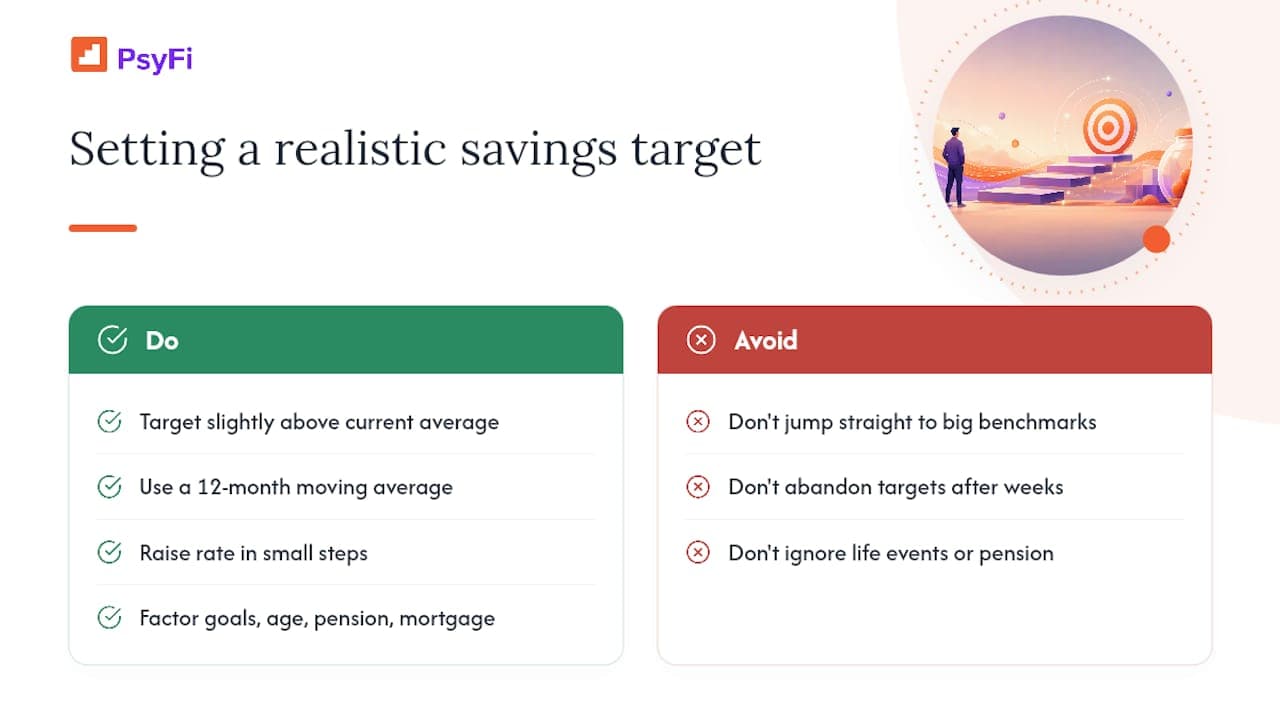
Set your target as a step above your current average rather than jumping straight to a benchmark number. If your 12-month moving average sits at 8%, aim for 11% next quarter, not 20%. Small, consistent gains compound better than an ambitious target you abandon in six weeks.
Practical ways to raise your savings rate
Most people don’t fail at saving because they lack willpower. They fail because their system requires willpower in the first place, and willpower is a limited resource that runs low by evening.
Behavioural changes that work with less effort:
Automate transfers on payday, before the money hits your chequing account and starts feeling spendable
Use small, scheduled increases (raising your automatic contribution by 1% every six months) rather than one big jump you’ll resent
Pre-commit windfalls before they arrive, decide now that your next bonus or tax refund goes straight to savings, not into a “we’ll see” account
Set up habit nudges, like a text reminder or app alert, tied to specific triggers like payday or the start of a new month
Tactical moves that move the needle fastest:
Capture your full employer 401(k) match first, before optimizing anything else, since that’s an immediate return no market investment can match
Redirect windfalls (tax refunds, bonuses, gifts) straight into savings instead of letting them blend into regular spending
Cut one large recurring cost (a car payment, subscription bundle, or overpriced insurance policy) rather than chasing dozens of small ones
Refinance high-interest debt where it makes sense, since interest payments are the most reliable savings-rate killer there is
Pro Tip: Set your automatic contribution increase to trigger the same week as any raise or cost-of-living adjustment. You’ll never “feel” the money leave because your take-home pay stays roughly the same as before the raise, and your savings rate climbs without a single willpower decision.
Behavioural defaults consistently outperform ad hoc self-control strategies for one simple reason: they remove the decision entirely. You’re not choosing to save every single payday. You already decided once, and the system carries the weight from there.
A calculation habit beats a perfect one
The biggest mistake I see people make isn’t picking the wrong formula. It’s recalculating once, getting discouraged by a low number, and never running it again. A savings rate only becomes useful information once you’ve tracked it across several months and can see direction, not just a snapshot.
Three pitfalls trip people up repeatedly: mixing gross and take-home income across different months, forgetting to include employer match (which quietly understates real progress), and treating a single bad month as a trend when it’s often just noise.
Here’s your five-day action list:
Pick your income base today and write it down
Pull last month’s actual numbers, not estimates
Run the calculation once using the steps above
Set up one automatic transfer increase, even a small one
Calendar a repeat calculation for the same date next month
Let PsyFi calculate and track it for you
Running this math once is useful. Running it automatically, every month, without opening a spreadsheet, is what actually changes behaviour. An app can link to your accounts, calculate your real savings rate from actual transaction data, and show you a moving 12-month trend instead of one noisy snapshot.
Beyond the number itself, the AI engine can flag the specific spending patterns pulling your rate down and send real-time nudges timed to when you’re most likely to act on them, not a generic monthly summary you skim and forget. If you’d rather start with a single number before committing to anything, try the free savings goal calculator to see what monthly contribution gets you to a specific target. When you’re ready for the automated version, a 7-day free trial of the PsyFi app gets your accounts linked and your first personalized savings plan built before the week is out.
Sources
Recommended
This content is provided for general informational and educational purposes only and does not constitute financial, investment, tax, or legal advice. PsyFi provides financial coaching tools and behavioral insights, not regulated advisory services. Always consult with a qualified financial advisor or tax professional regarding your personal situation before making financial decisions.
Keep reading
- Pay Off Debt or Save First? How to Decide in 2026Should you pay off debt or save first? A clear order of steps, a worked example and the behavioral traps that derail plans, so you can act this month.

- SMART Financial Goals: How to Set Them and Keep ThemLearn how to set SMART financial goals with worked US examples for saving, debt, retirement and investing, plus the habits that close the intention-action gap.

- Dopamine Spending: Why Shopping Feels Good and How to Stop