

Net Worth by Age: What’s Typical and How to Use It
See median and average U.S. net worth by age from the Federal Reserve, why the two differ, and how to track your own number without shame or stress.
By Maanya Nagpal, Co-Founder of PsyFi
In the Federal Reserve’s latest full survey, the typical U.S. family under 35 had a net worth of $39,000, and the typical family aged 65 to 74 had $409,900. Those are medians, meaning half of families had less and half had more. They describe what happened to a wide mix of households in 2022. They are not a score you have to beat.
Below, you’ll find the numbers by age, why averages and medians tell different stories, and a calm way to track your own net worth. This is general education, not personal investment, tax or legal advice, and PsyFi is not a licensed financial advisor.
TL;DR
Net worth is what you own minus what you owe. Negative or low numbers are common, especially early in life, and they say nothing about your character.
Use the median, not the average. The Fed’s 2022 median family net worth was $192,900, while the mean was $1,063,700, pulled up by a small group of very wealthy families.
Age tables mix homeowners and renters, singles and couples. Your trend over time matters more than any single benchmark.
Pick one check-in rhythm, automate saving, and focus on what you control.
Table of Contents
What net worth means (and what it leaves out)
The Federal Reserve defines net worth as the difference between assets and liabilities. In plain words: add up what you own, then subtract what you owe.
Counts as an asset | Counts as a liability (debt) |
|---|---|
Checking and savings | Credit card balances |
Retirement accounts (401(k), IRA) | Student loans |
Brokerage investments | Auto loans |
Home equity (home value minus mortgage) | Mortgage balance |
Other items you could sell for cash | Personal loans, medical debt |
Net worth does not measure income, happiness or how hard you work. Someone with a high salary and big loans can have a lower net worth than someone who earns less and owes little. It is a snapshot, and snapshots change.
Median net worth by age in the U.S.
The numbers below come from the Fed’s 2022 Survey of Consumer Finances, summarized in its October 2023 report on family finances. Age is the age of the family’s reference person, and all figures are in 2022 dollars.
Age group | Median net worth | Mean (average) net worth |
|---|---|---|
Under 35 | $39,000 | $183,500 |
35 to 44 | $135,600 | $549,600 |
45 to 54 | $247,200 | $975,800 |
55 to 64 | $364,500 | $1,566,900 |
65 to 74 | $409,900 | $1,794,600 |
75 and older | $335,600 | $1,624,100 |
All families | $192,900 | $1,063,700 |
A few things stand out:
Wealth usually climbs through midlife and peaks at 65 to 74. Then it dips for those 75 and older. That reflects saving, home and investment values, debt payoff and retirement withdrawals.
The youngest group grew fastest. The Fed reports that median net worth for families under 35 rose 143%, from $16,100 to $39,000, between 2019 and 2022. They were still the least wealthy age group.
These data are not current. The survey is run periodically, not every year, so today’s figures may differ.
Why the average is so much higher than the median
In 2022, the mean family net worth was $1,063,700, while the median was $192,900. A small number of very wealthy families pull the mean up. That is why you see “average net worth by age” numbers that feel out of reach.
Think of ten people in a room, nine with modest savings and one billionaire walks in. The average jumps. Nobody else got richer.
Measure | What it tells you | Best use |
|---|---|---|
Median | The middle family: half have less, half have more | Checking where you sit |
Mean (average) | Total wealth divided by number of families | Understanding overall wealth, not typical households |
Percentile | Your rank, such as the 60th means ahead of 60% | Rough context, with caution |
Why your number may not match your age group
The Fed’s tables measure families, not individuals, and they include household assets and debts. That creates big differences at the same age:
Homeowner or renter. Home equity is often the largest asset a family has. Renters can save diligently and still show a smaller number.
Single or couple. Two incomes and two sets of accounts can raise the total. Comparing a household figure with your solo balance is not apples to apples.
Student loans and timing. Many people start their 20s or 30s with debt, and that can push net worth below zero.
Caregiving, health costs, career breaks. Life events change the math.
Negative net worth is not a moral verdict. In the 2022 Fed data, the bottom 25% of families had a median net worth of $3,500, with a negative mean of $5,300. If you are in that range, you have plenty of company, and the direction you are heading matters most.
Retirement accounts are not net worth
You will also see 401(k) balances by generation. They are useful, but they cover only one slice of your finances.
Generation | Average 401(k) balance (Fidelity, 2026) |
|---|---|
Gen Z | $18,000 |
Millennials (born 1981 to 1996) | $82,600 |
Gen X | $215,600 |
Baby boomers | $260,300 |
These figures come from Fidelity’s average retirement savings analysis. Averages here include only people who have these accounts, and they vary by provider. Vanguard’s 2024 data showed a $148,153 average participant balance but a $38,176 median. Again, a few large balances lift the average.
Older groups also had more years of earning, contributing and investment growth. Comparing yourself to them without that context tends to create anxiety, not insight.

A better question than “Am I behind?”
Age tables can trigger what psychologists call the “what the hell” effect: you feel behind, so you stop trying. We would rather you ask questions you can act on:
Is my net worth higher than it was three or six months ago?
Am I saving a little automatically, without relying on willpower?
Do I have a small emergency cushion?
Is my highest-interest debt shrinking?
The automation point has evidence behind it. In Vanguard’s report, plans with automatic enrollment had a 94% participation rate, compared with 64% for voluntary-enrollment plans. When saving happens by default, more people do it.
How to calculate and track your net worth
You can do this in about 20 minutes with a notebook, a spreadsheet or a tool such as our free net worth calculator.
Step | What to do | Tip |
|---|---|---|
1 | List every account balance as of today | Use current balances, not memory |
2 | Add up assets | Include home equity, not the full home value |
3 | List every debt with its current balance | Include small ones too |
4 | Subtract debts from assets | A negative result is a starting point, not a failure |
5 | Record the number and the date | One line in a spreadsheet is enough |
6 | Repeat monthly or quarterly | Not daily |
Check monthly or quarterly rather than reacting to every market move. A falling market can lower your account values even while your saving behavior is improving. That is why we suggest tracking your actions (amount saved, debt paid) alongside the total.
If you are comparing yourself with a percentile calculator, first decide whether you are entering individual or household data. Public survey percentiles also depend on weighting and variable definitions, so treat the output as a rough guide.
If looking at your accounts feels stressful
Many people avoid their balances because looking feels like judgment. If that is you, try this:
Set a 10-minute timer once a month.
Write down the number only. No grading.
End the session with one small action, such as increasing an automatic transfer by $10.
Our Financial Wellness Score can also give you a neutral starting point.
A personal cash flow statement: the missing half
Net worth is a snapshot. A personal cash flow statement shows the movie: what came in and what went out over a month. It explains why your net worth is moving.
Line | Example entry (illustrative) |
|---|---|
Take-home pay (after taxes and deductions) | Your monthly deposit amount |
Fixed costs (rent, insurance, loan minimums) | Same each month |
Variable costs (food, transport, fun) | Changes each month |
Saving and extra debt payments | What you moved on purpose |
Left over (or shortfall) | Income minus everything above |
If the last line is positive and you direct it somewhere on purpose, your net worth usually rises over time. If it is negative, look first at recurring charges and stress-driven purchases. Our guide to building a savings plan with an exact monthly target walks through it.
Practical moves by life stage
There is no deadline here. These are general ideas to consider, and the right choices depend on your situation.
Stage | A reasonable focus | Helpful resource |
|---|---|---|
Starting out | Build a small safety net, avoid new high-interest debt | |
Building | Automate savings and raise your retirement contribution gradually | |
Housing decisions | Compare the real cost of renting and buying | |
Approaching retirement | Check projected balances and plan limits |
If you want to add income, there are low-barrier ideas in this guide to earning money online without investing. Read the terms of any site carefully first.
Retirement limits, for context
The IRS sets 2026 limits: $24,500 for employee 401(k) and 403(b) deferrals, an $8,000 catch-up for people 50 or older, and $11,250 for those turning 60 through 63 if the plan allows it. These are legal ceilings, not targets. A higher limit does not mean you should stretch your budget to hit it. Cash-flow stability, high-cost debt and near-term needs usually come first. For tax questions specific to you, talk to a tax professional.

What about asset allocation by age?
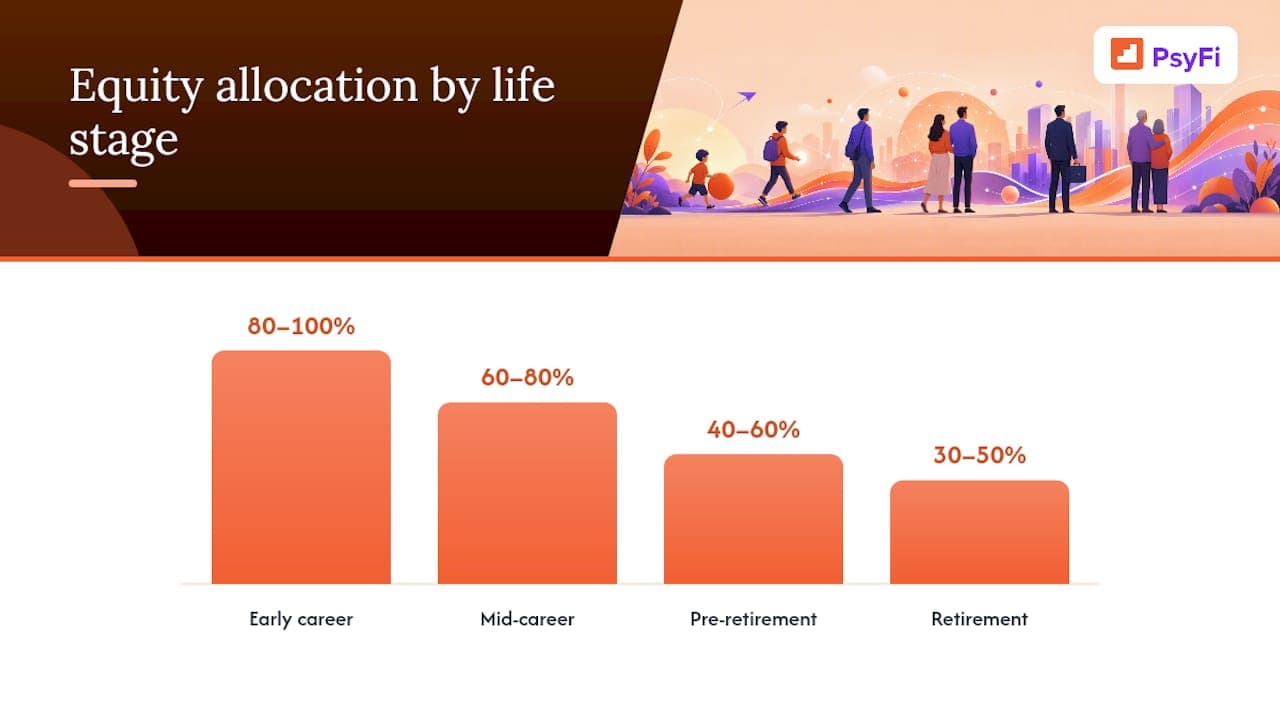
Asset allocation means how you split money among stocks, bonds and cash. Many articles show charts that shift toward safer assets as you age. Those charts are general rules of thumb, not personal advice. Your timeline, income stability, risk comfort and goals matter more than your birthday. A licensed financial advisor can help you decide. Our post on writing one goal and a date for an investing plan is a good way to get clear before that conversation.
Our perspective: fix the why, not just the number
At PsyFi, we see the same pattern again and again. Most apps tell you what you spent. Few explain why. Someone who stress-spends after a hard week and someone who simply never set up automatic savings need different help, even if their net worth is identical.
That is why we do not treat an age table as a verdict. We think the first useful milestone is making the number visible without judgment, choosing one repeatable check-in, and separating what you control (saving automatically, reviewing subscriptions, paying down debt) from what you do not (market swings). Our coaching is built on behavioral science, guided by a University of Toronto psychology professor, and our recommendations are explainable, so you stay in control of every action.
If your number is lower than the table says, that is information, not shame. Start where you are.
— Maanya Nagpal
Track your trend with PsyFi
PsyFi links your accounts, shows spending and net worth dashboards, and gives you a daily check-in based on your own habits. Premium costs $9.99 per month or $69.99 per year, and it starts with a 7-day free trial. You can see more on our features page. Ready to try it? Download the PsyFi app and watch your trend, not the table.
FAQ
What is a good net worth for my age?
There is no single good number. The Fed’s 2022 medians range from $39,000 for families under 35 to $409,900 for ages 65 to 74, but your housing, household and debt picture all change what is realistic. A better measure is whether your net worth is rising over time.
Should I use average or median net worth?
Use the median. The average is pulled up by a small group of very wealthy families, which is why the 2022 mean of $1,063,700 is so far above the $192,900 median.
Does my home count in net worth?
Yes, as home equity: what the home is worth minus what you owe on it. Because many families hold much of their wealth there, homeowners and renters often look very different at the same age.
How often should I check my net worth?
Monthly or quarterly works for most people. Checking more often can make normal market swings feel like personal failures.
Sources
Recommended
This content is provided for general informational and educational purposes only and does not constitute financial, investment, tax, or legal advice. PsyFi provides financial coaching tools and behavioral insights, not regulated advisory services. Always consult with a qualified financial advisor or tax professional regarding your personal situation before making financial decisions.
Keep reading
- Asset Allocation by Age: Balance Your Portfolio 20s to 60sStruggling to figure out your ideal stock-to-bond ratio? Discover decade-by-decade asset allocation frameworks, overcome the psychological barriers behind rebalancing, and build a portfolio tailored to your stage in life.

- Write One Goal and Date to Build a Personalized Investing PlanTurn one written goal into a personalized investing plan. Learn life stage allocations, tax smart account choices, and simple behavioral rules to stay on...